View Active Linux Processes Using procs
Traducciones al EspañolEstamos traduciendo nuestros guías y tutoriales al Español. Es posible que usted esté viendo una traducción generada automáticamente. Estamos trabajando con traductores profesionales para verificar las traducciones de nuestro sitio web. Este proyecto es un trabajo en curso.
The procs utility is a useful and informative alternative to the original Linux
ps (process status) command. Like ps, procs displays information about the active processes running on the system, including their CPU and memory usage. However, procs enhances its output with additional columns, an intuitive color scheme, and other helpful features. This guide provides some background on procs, and explains how to install and use it.
An Introduction to procs
Procs is an open source replacement for the ps command. It is written in the Rust programming language, which is known for its performance and maintainability. Procs is fully supported on Linux, and experimentally supported on macOS and Windows systems with some limitations. Here are some of its highlights and advantages:
- By default, procs displays the Process Id, User, CPU Usage, Memory Usage, CPU Time, and the command name.
- It can additionally display information that is not available in
ps. Some of these columns include the TCP or UDP port, the read/write throughput, and information about virtual memory usage. - It contains support for Docker containerization.
- Output is presented in a color-coded and human-readable format. A configuration file allows users to customize the display and the information that is shown. Tree view is supported.
- It adds pagination support, where users can inspect the output one page at a time.
- It allows users to search for multi-column keywords.
- It supports “watch mode”, which is similar to the
topcommand in Linux. - It has additional keyboard shortcuts not found in
ps.
The procs GitHub page has a complete list of all the attributes it can display.
Comparing ps to procs
The procs utility is very similar to the ps command which it seeks to replace. Procs can do everything ps does, but it can also display additional fields and has more options. For this reason it is the better choice in most cases. However, both commands have the most significant information available. The ps command is often supplemented with the top command. top displays a real-time view of the most resource-intensive processes. In procs, the --watch and --watch-interval options provide the same information. Procs supports tree format and customization, while ps does not.
Because the ps command’s output is relatively sparse, users often append the -ef option for more meaningful results. ps is often used in conjunction with other commands, such as grep, to extract and summarize information. For more information about the ps command, see the
Linode ps guide.
Before You Begin
If you have not already done so, create a Linode account and Compute Instance. See our Getting Started with Linode and Creating a Compute Instance guides.
Follow our Setting Up and Securing a Compute Instance guide to update your system. You may also wish to set the timezone, configure your hostname, create a limited user account, and harden SSH access.
sudo. If you are not familiar with the sudo command, see the
Users and Groups guide.How to Install procs
Procs can be installed using one of several package installers or by downloading the binary. Some Linux distributions include procs as part of the default package. However, a package is not available in the standard Ubuntu distribution.
Installing procs with a Package Manager
Both the Homebrew and snap package managers can be used to install procs.
Follow the steps below to install procs using Homebrew:
If Homebrew is not already installed, install it using the Homebrew script.
/bin/bash -c "$(curl -fsSL https://raw.githubusercontent.com/Homebrew/install/HEAD/install.sh)"Follow the instructions in the script and run the following commands. These instructions add Homebrew to the
$PATHvariable and install some additional components.echo 'eval "$(/home/linuxbrew/.linuxbrew/bin/brew shellenv)"' >> /home/userid/.profile eval "$(/home/linuxbrew/.linuxbrew/bin/brew shellenv)" sudo apt-get install build-essential brew install gccVerify Homebrew is working properly using the
brew doctorcommand.Note Use thebrew helpcommand to see a full list of the Homebrew commands.brew doctorYour system is ready to brew.Install procs using the
brewcommand.brew install procs
The snap package manager can also install procs. Snap should already be installed on most Linux systems. If it is not available, consult the snap website for more instructions.
Use the following command to install procs using snap.
sudo snap install procs
procs v0.11.8 from dalance installedOn certain Linux distributions, the default system package manager can be used to install procs:
- For Fedora systems, use the command
sudo dnf install procs. - Use
sudo apk add procson Alpine Linux. - On an Arch Linux system use
sudo pacman -S procs. - If Rust and its package manager Cargo are already installed, install procs using the
cargo install procscommand.
Installing procs from Binary Files
You can also install procs using the binary file. To download and install procs using this method, follow these steps.
Select the correct file for the system from the procs GitHub releases page. Download the file directly to the system using
curlorwget, or transfer it from another system using a utility such asscp.wget https://github.com/dalance/procs/releases/download/v0.11.10/procs-v0.11.10-x86_64-lnx.zipUnzip the file with the
unzipprogram. If necessary, usesudo apt install unzipto installunzipfirst.unzip procs-v0.11.10-x86_64-lnx.zipCopy the file to a directory referenced within
$PATH, such as/usr/local/bin/.sudo mv procs /usr/local/bin/Change the file permissions.
sudo chmod +x /usr/local/bin/procs
How to Use procs to View Linux System Processes
The procs application is very simple to use. To ensure it is installed correctly and to confirm the version number, use the -V option.
procs -V
procs 0.11.10To view a list of all the flags and options, use the procs -h command.
procs -h
procs 0.11.10
A modern replacement for ps

please see https://github.com/dalance/procs#configuration to configure columns

USAGE:
    procs [FLAGS] [OPTIONS] [--] [KEYWORD]...

FLAGS:
    -a, --and          AND  logic for multi-keyword
    -o, --or           OR   logic for multi-keyword
    -d, --nand         NAND logic for multi-keyword
    -r, --nor          NOR  logic for multi-keyword
    -l, --list         Show list of kind
        --thread       Show thread
    -t, --tree         Tree view
    -w, --watch        Watch mode with default interval (1s)
        --config       Generate configuration sample file
        --no-header    Suppress header
    -h, --help         Prints help information
    -V, --version      Prints version information

OPTIONS:
    -W, --watch-interval <second>    Watch mode with custom interval
    -i, --insert <kind>...           Insert column to slot
        --only <kind>                Specified column only
        --sorta <kind>               Sort column by ascending
        --sortd <kind>               Sort column by descending
    -c, --color <color>              Color mode [possible values: auto, always, disable]
        --theme <theme>              Theme mode [possible values: auto, dark, light]
    -p, --pager <pager>              Pager mode [possible values: auto, always, disable]
        --interval <millisec>        Interval to calculate throughput [default: 100]
        --completion <shell>         Generate shell completion file [possible values: zsh, bash,
                                     fish, powershell, elvish]

ARGS:
    <KEYWORD>...    Keywords for search
Basic procs Usage
On some systems, special characters can scramble the procs display. To avoid this problem, add the following line to your .bashrc file.
- File: ~/.bashrc
1export LESSCHARSET=utf-8
Then, run the command source ~/.bashrc to initialize the changes.
By default, procs displays the following fields:
- The process ID (PID).
- The name of the user who owns the resource (User).
- The filename of the terminal connected to standard input (TTY).
- The percentage of CPU the process is using (CPU %).
- The percentage of memory the process is using (MEM %).
- The CPU time.
- The command associated with the process (Command). Additional arguments or parameters are not displayed.
To display basic information about all processes, use procs without any other commands.
procs
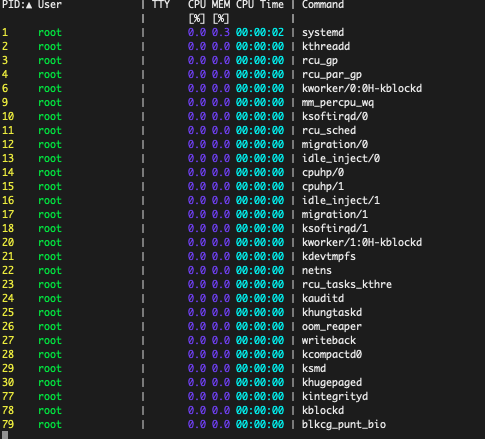
To see the rest of the processes, use the ENTER key or scroll through the list using the up and down arrows.
Type q to exit the procs application. On some systems, the CONTROL-c key also ends the program.
q
To search for a process, enter a search term in either string or numeric format. If a non-numeric string is used, procs displays any processes where either the user name or command name match the keyword. The following command lists all the processes that match the term dev.
procs dev

If a numeric search term is used, procs matches it against the process ID. For example, procs 11 searches for a process with a process ID of 11.
![]()
Search terms can be joined together using logical operators. If the option --and is specified, the process must match all terms. With the --or option, processes that match any of the terms are displayed.
procs --or 11 21
Procs can display results in “tree” format. Subprocesses are shown as leafs of the parent process. Use the procs --tree command to display processes in this format.
procs --tree
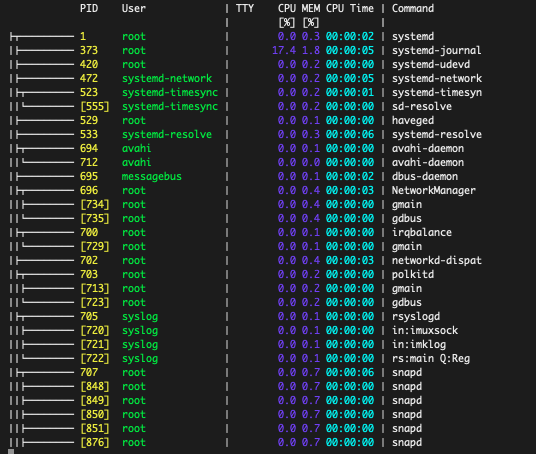
For real-time information about the top processes, use the --watch keyword. The resulting behavior is very similar to the Linux top command. The watch function automatically updates the results every second. Results are ordered based on the currently active column, which is highlighted. The active column can be sorted in ascending order using the a key, or in descending rank with a d. Use the q key to quit. The n key is used to select the next column.
procs --watch
For a longer update interval, use the --watch-interval option along with the interval. The same shortcuts for the --watch option are applicable.
procs --watch-interval 5
Advanced procs Usage
Users can display additional columns and sort results by any column. Procs also allows users to use a configuration file to customize the default behavior.
In the latest release, users can temporarily add a new column on a case-by-case basis without defining it in the configuration file. In earlier releases, users had to add a default “wild card” slot to the configuration file and use it to display a new column.
To add an additional column to the procs display, use the --insert option and the column identifier. For a list of all possible column identifiers, see the kind table in the Configuration section of the procs GitHub page.
procs --insert VmSize
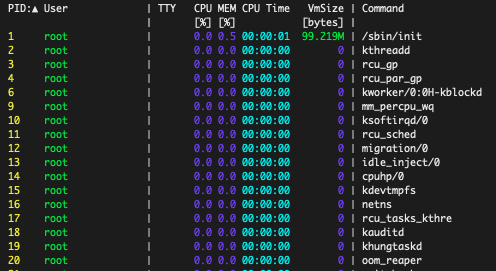
The output can be sorted based on any column using the --sorta and --sortd options plus the name of the column. --sorta sorts the output in ascending order, while --sortd orders it in descending order. A list of the column identifiers are found in the kind table on the procs GitHub page. The following command orders the processes based on the amount of memory they are using.
procs --sortd UsageMem
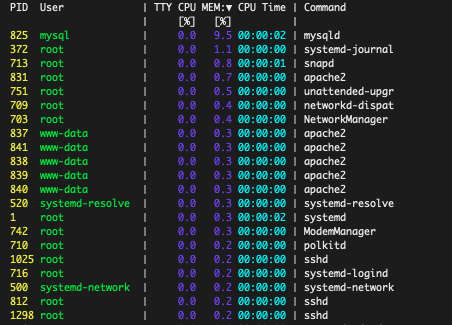
Users can personalize the default procs behavior using a config.toml file. When procs is first installed, there is no configuration file and the program uses the default settings. To modify the behavior on an ongoing basis, create a default .toml file and paste in the default configuration. Add or modify the columns or change the display or color scheme as required. For more information, see the procs GitHub site. To modify the procs settings, follow these steps.
Create a configuration file for procs at
~/.config/procs/config.toml.mkdir ~/.config/procs touch ~/.config/procs/config.tomlDisplay the default configuration using the
--configoption.procs --configCopy the output from the beginning of the
[[columns]]section to the bottom of the file.Paste the entirety of the copied text into the new
config.tomlfile.Change or add any formatting as required. Sample configuration files can be found on the procs GitHub site. For example, the following configuration snippet adds the
VmDatafield to the configuration. Paste this text into the file right before the final separator in the[[columns]]section.- File: ~/.config/procs/config.toml
1
2
3
4
5
6
7
[[columns]] kind = "VmData" style = "ByUnit" numeric_search = false nonnumeric_search = false align = "Right"
Save the file.
Launch the procs application again. The new column should now appear as part of the display.
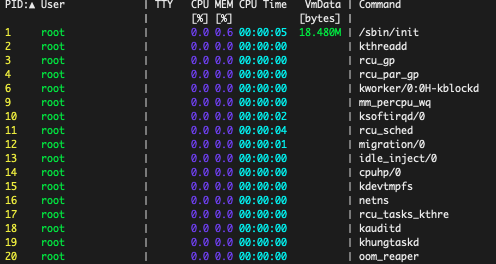
Note It can be somewhat difficult to change the configuration using the method outlined in this section. New columns must be added in a certain order and in the proper format. Procs silently ignores non-compliant or improperly formatted configuration. For a ready-made configuration file that displays most of the useful columns, use the standardized large.toml template file. It might be easier and less error-prone to start with this file and remove any unwanted columns or configuration.
A Summary of the procs Application
The procs program is a handy application offering numerous upgrades over the standard Linux ps command. It provides a color-coded display in a more intuitive format and offers additional information that is not available in ps. Additional features include a paging system, an option to view results in tree format, and a watch option that is similar to the Linux top command.
It is easy to search processes using a string or numerical identifier, and to order results by any column. The standard procs display can be customized using a configuration file. Procs is available for most Linux systems and can be installed using one of several different package managers.
More Information
You may wish to consult the following resources for additional information on this topic. While these are provided in the hope that they will be useful, please note that we cannot vouch for the accuracy or timeliness of externally hosted materials.
This page was originally published on
